Ask your logs what went wrong
There is now an Explain this button on your app's Logs tab. It reads the recent output, tells you in plain English why the app is not running, and links to the setting that fixes it. Here is what it knows, what it sends, and where it gives up.
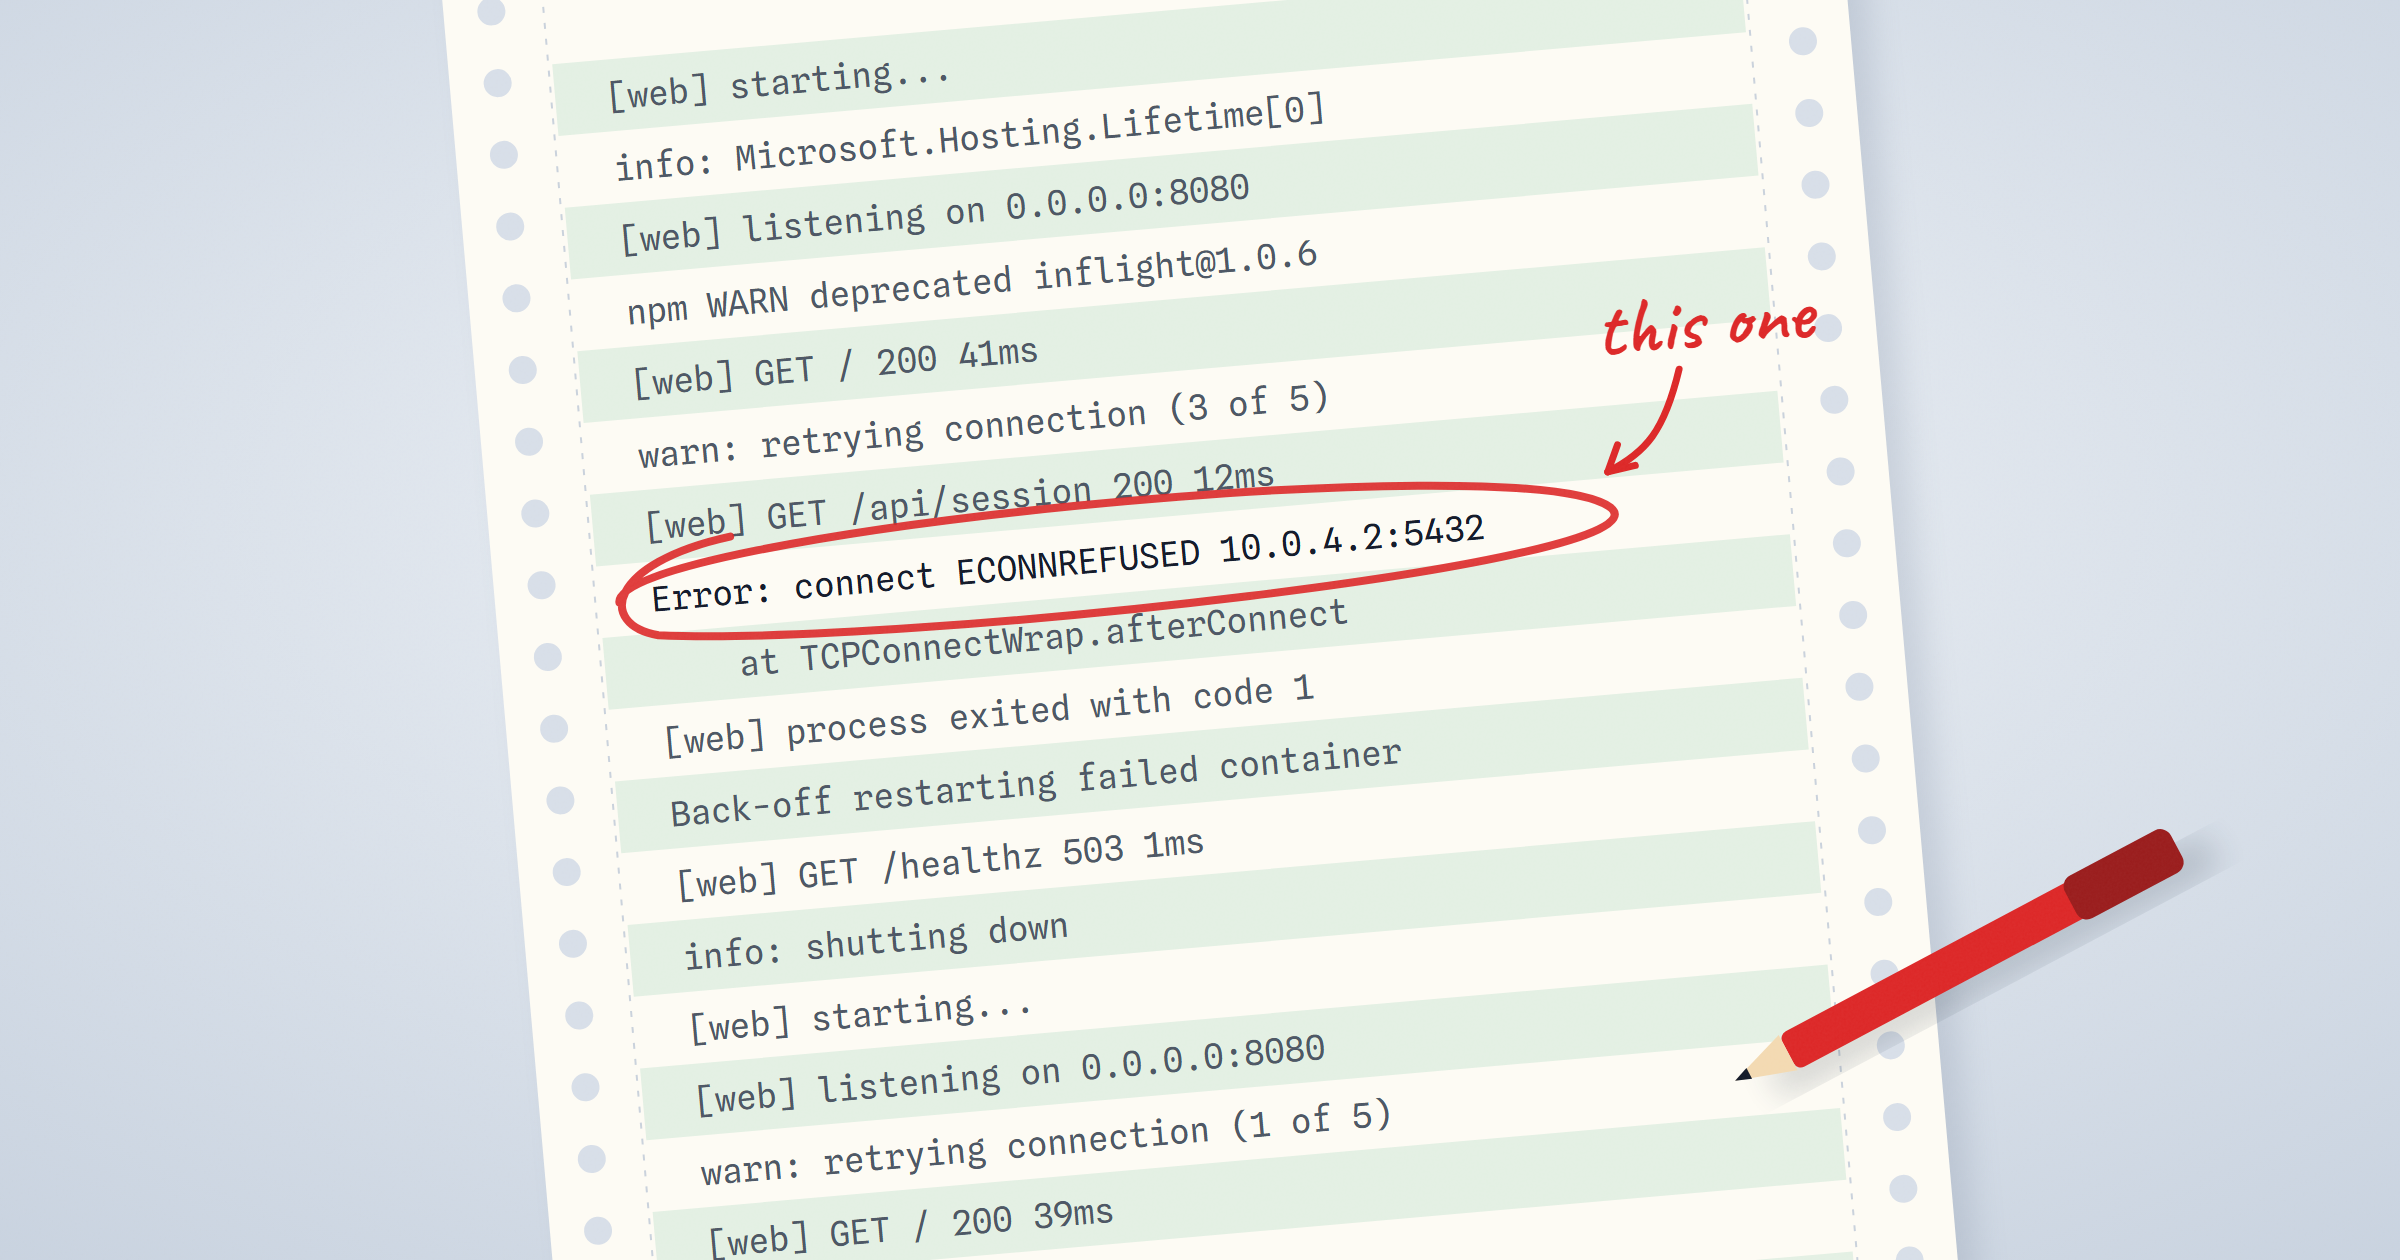
The first deploy is where we lose people.
Not because the platform is broken. Because the app is doing exactly what it did on the laptop, and on the laptop that was fine. It starts, it prints a cheerful line about listening on port 3000, and then nothing. The health check fails. The container restarts. It fails again. The dashboard says CrashLoopBackOff, which means nothing at all to most of the people reading it, and the logs are 400 lines of framework startup noise with the one important line buried somewhere in the middle.
I have watched this happen enough times to know how it ends. Some people dig in and find it. Most people close the tab.
The frustrating part is that it is almost always the same handful of causes. The app hardcoded a port instead of reading the one we hand it. The app bound localhost instead of 0.0.0.0, so it is running perfectly and nothing outside it can get in. A .env file that lives on the laptop and was never deployed, so a connection string is empty. A database URL that was copied into the wrong field.
None of those are hard problems. They are just invisible if nobody has told you the rules.
So we stopped waiting for people to learn the rules and put a button on the Logs tab instead.
What it does
Click Explain this and it reads your app's recent output and answers in the order you actually want it:
One sentence saying what is wrong. Not a summary of the logs. The cause. "Your app is listening on 127.0.0.1, so nothing outside it can get in."
Ordered steps to fix it. Actions, not advice. "Bind to 0.0.0.0 instead of localhost" beats "consider reviewing your network binding configuration."
The log lines it based that on, so you can check the reasoning instead of trusting it. This one matters to me. A confident wrong answer with no evidence is worse than no answer, because it sends you off fixing the wrong thing for an hour.
A confidence level, shown honestly. If the logs are ambiguous it says low confidence and gives you its best guess anyway, flagged as a guess. It does not do the thing where a model states a coin flip in the same tone as a certainty.
And when the fix is a velixir setting rather than a code change, it links straight to the tab. Missing environment variable, wrong scaling config, a domain that never verified: you get taken to the place where you fix it, not told to go find it.
Why it is better than pasting your logs into a chatbot
You can already copy a stack trace into any general-purpose model and get a decent answer. This is better for one specific reason: it knows where your app is running.
A general model sees "connection refused" and gives you the five things that usually cause connection refused. This one knows that we inject a PORT environment variable, that we health-check over HTTP, that the app has to bind 0.0.0.0 because it sits behind our edge proxy, that a local .env file is not deployed, and which environment variable names your app actually has set. With that context, "connection refused" stops being a guessing game. It can say the specific thing that is true about your app.
It also knows the failure it is looking at is a deploy failure, not a runtime bug in your business logic. That narrows the search enormously.
What gets sent, and what does not
Logs are your data. Your app can print anything into them, including things it absolutely should not, and we are handing them to a model. So:
It only runs when you click it. Never on page load, never automatically when a deploy fails, never in the background. Nothing leaves the platform until you press the button, and the button tells you where the text goes before you press it.
Environment variable values are never sent. The names are, because "you have DATABASE_URL set but not REDIS_URL" is a genuinely useful diagnosis. The values stay here. There is no version of this feature that is worth shipping a customer's database password to a third party.
The model is Mistral's, which is French. For a company whose entire pitch is that your infrastructure stays in Europe, sending your logs to a US model would have been a slightly awkward thing to explain.
Where it gives up
I would rather tell you this than have you find out.
It is very good at the boring failures, which is deliberate, because the boring failures are most of them. Ports, bindings, missing configuration, a dependency that is not installed, a migration that did not run. If your app is failing for one of those reasons, it will usually name it on the first click.
It is much weaker on anything that needs to see your code. If your app starts fine and then returns wrong answers, the logs may not contain the problem at all, and no amount of reading them will find it. It will say low confidence, and you should believe it.
It also cannot help if there are no logs. An app that dies before printing anything gives it nothing to work with, and it will tell you that rather than inventing a theory.
It is a starting point, not a verdict. It is meant to turn "I have no idea where to begin" into "oh, it is the port," which for most first deploys is the entire distance.
Try it
It is on the Logs tab of any app. If your last deploy went badly, it is probably one click from telling you why.
Got an app to ship? velixir hosts it in any language, on servers in the EU.
Start free - your first month's on us